Other Links:
Battleground States
Breakdowns of the State of Every Competitive State in 2020 - including polling, the political landscape, and Trump’s approval rating
Explanation:
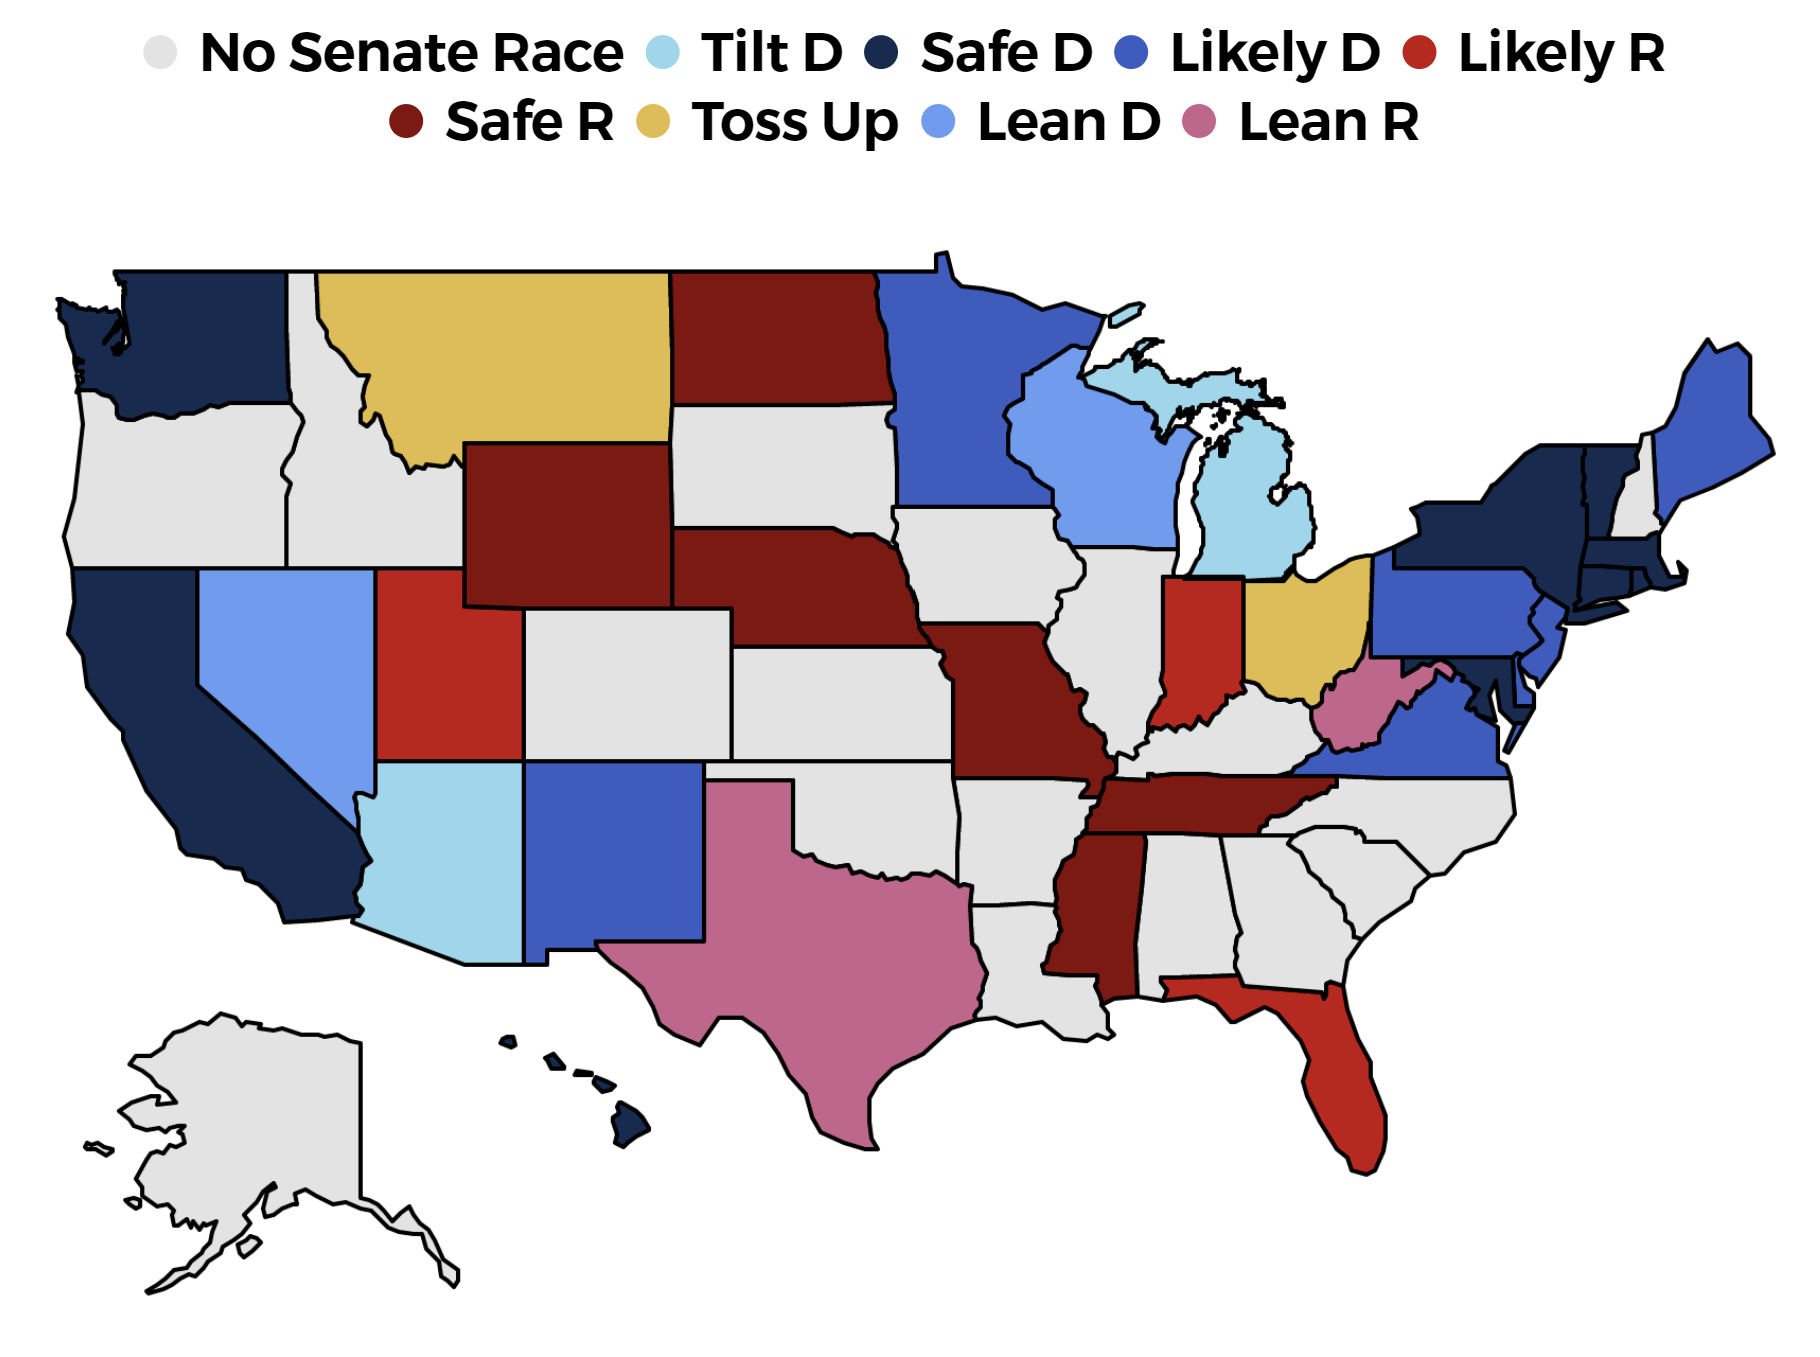
Intro: This page shows how often the Race to the Senate Forecast expects each candidate to win the election. At the top, you can choose any of the 35 Senate Races to look at. The swing states are listed first, followed by all of the states in alphabetical order.
Trend over Time: You can check out how the Race to the Senate Forecast Win Percentage for every state has changed since January 1st of 2020.
Projected Margin of Victory: Here, you will see a breakdown of each component that affects the Projected Margin of Victory – or in other words which party is projected to win on election day, and how much the forecast expects them to win by. All seven components will either give Democrats or Republicans an advantage.
State Polls: State Polls section shows the polling average for each candidate. I keep a database of all senate polls released during the cycle, and weigh them based off quality, sample size, recency, and several other factors to get a polling average. Want to know more about how it works? Check out the Presidential Forecast Methodology. The Senate Forecast Methodology will be released in the future, but state polling averages are calculated almost the exact same way for both Forecast. You can also see how the polls have changed for every Senate race, and a list of all polls in the database here.
Approval Ratings: Polls often ask their recipients whether they approve or disapprove of a candidate for Senate. The popularity of both the incumbent and challengers play an important role in the forecast - and it often signals how much the race can change by election day. If many voters do not know enough about the candidate, advertisement campaigns and new developments in the race can really change the contours of the election. Additionally, an unpopular incumbent facing, and unknown challenger will often be in trouble if the challenger becomes popular.
6. Fundraising: This tracks how much each candidate has raised from individual donors - or in other words, the donations that are given by real people, limited to federal maximum of $2,800. I exclude money from PACs - which have far looser fundraising rules and are often driven more by big donors and special interest. Why? Money raised from individuals’ donors is a much better predictor of performance during an election. A candidate that raises money this way typically has built genuine grassroots enthusiasm and a good message that is usually a harbinger for a good turnout among their supporters. On the other hand, someone that is not raising much from individuals but is getting a lot of money in PACs could potentially only be getting so much money because they are performing worse than expected in a competitive race. All of this data is from fec.gov.
7. Experience: Candidates that have won elected office before tend to perform better than new candidates with no experience. Everyone gets a score from 0 to 3.0 based off the highest elected office they have won, and whichever candidate has a higher score gets a boost in the Projected Margin of Victory. The highest score, 3.0, is reserved for Governors and Senators.
8. Partisan Lean: The Partisan Lean of each state reveals how much the state prefers Democrats or Republicans compared to the nation at large. Readers with an eagle eye will notice these are different in the Presidential Forecast. Why? The Senate forecast gives much more weight to midterm elections. 37% of the score comes from 2018, 55.6% comes from 2016, and 7.4% comes from 2018.
9. The National Polls track which party voters say they prefer when given the choice between a generic Democrat or generic Republican for the House & Senate.
10. Last Election: This track how much incumbents won their last election by - so naturally this is not factored in for races without an incumbent senator.
Most incumbents running in 2020 won their election in 2014, a Republican wave year, while some won in 2018 Special Elections, a Democrat wave year. To put everyone on the same playing field, the forecast adjusts their margin to compensate for the national political environment. Second, their lead is adjusted to compensate for any shifts in the states political lean since their victory. Third, candidates get a boost if they beat a sitting incumbent or won an open seat, both of which are tougher to do than simply winning re-election. Finally, their margin is slightly tweaked downward if they won by 25% or more.


