RacetotheWH Forecast & Interactives:
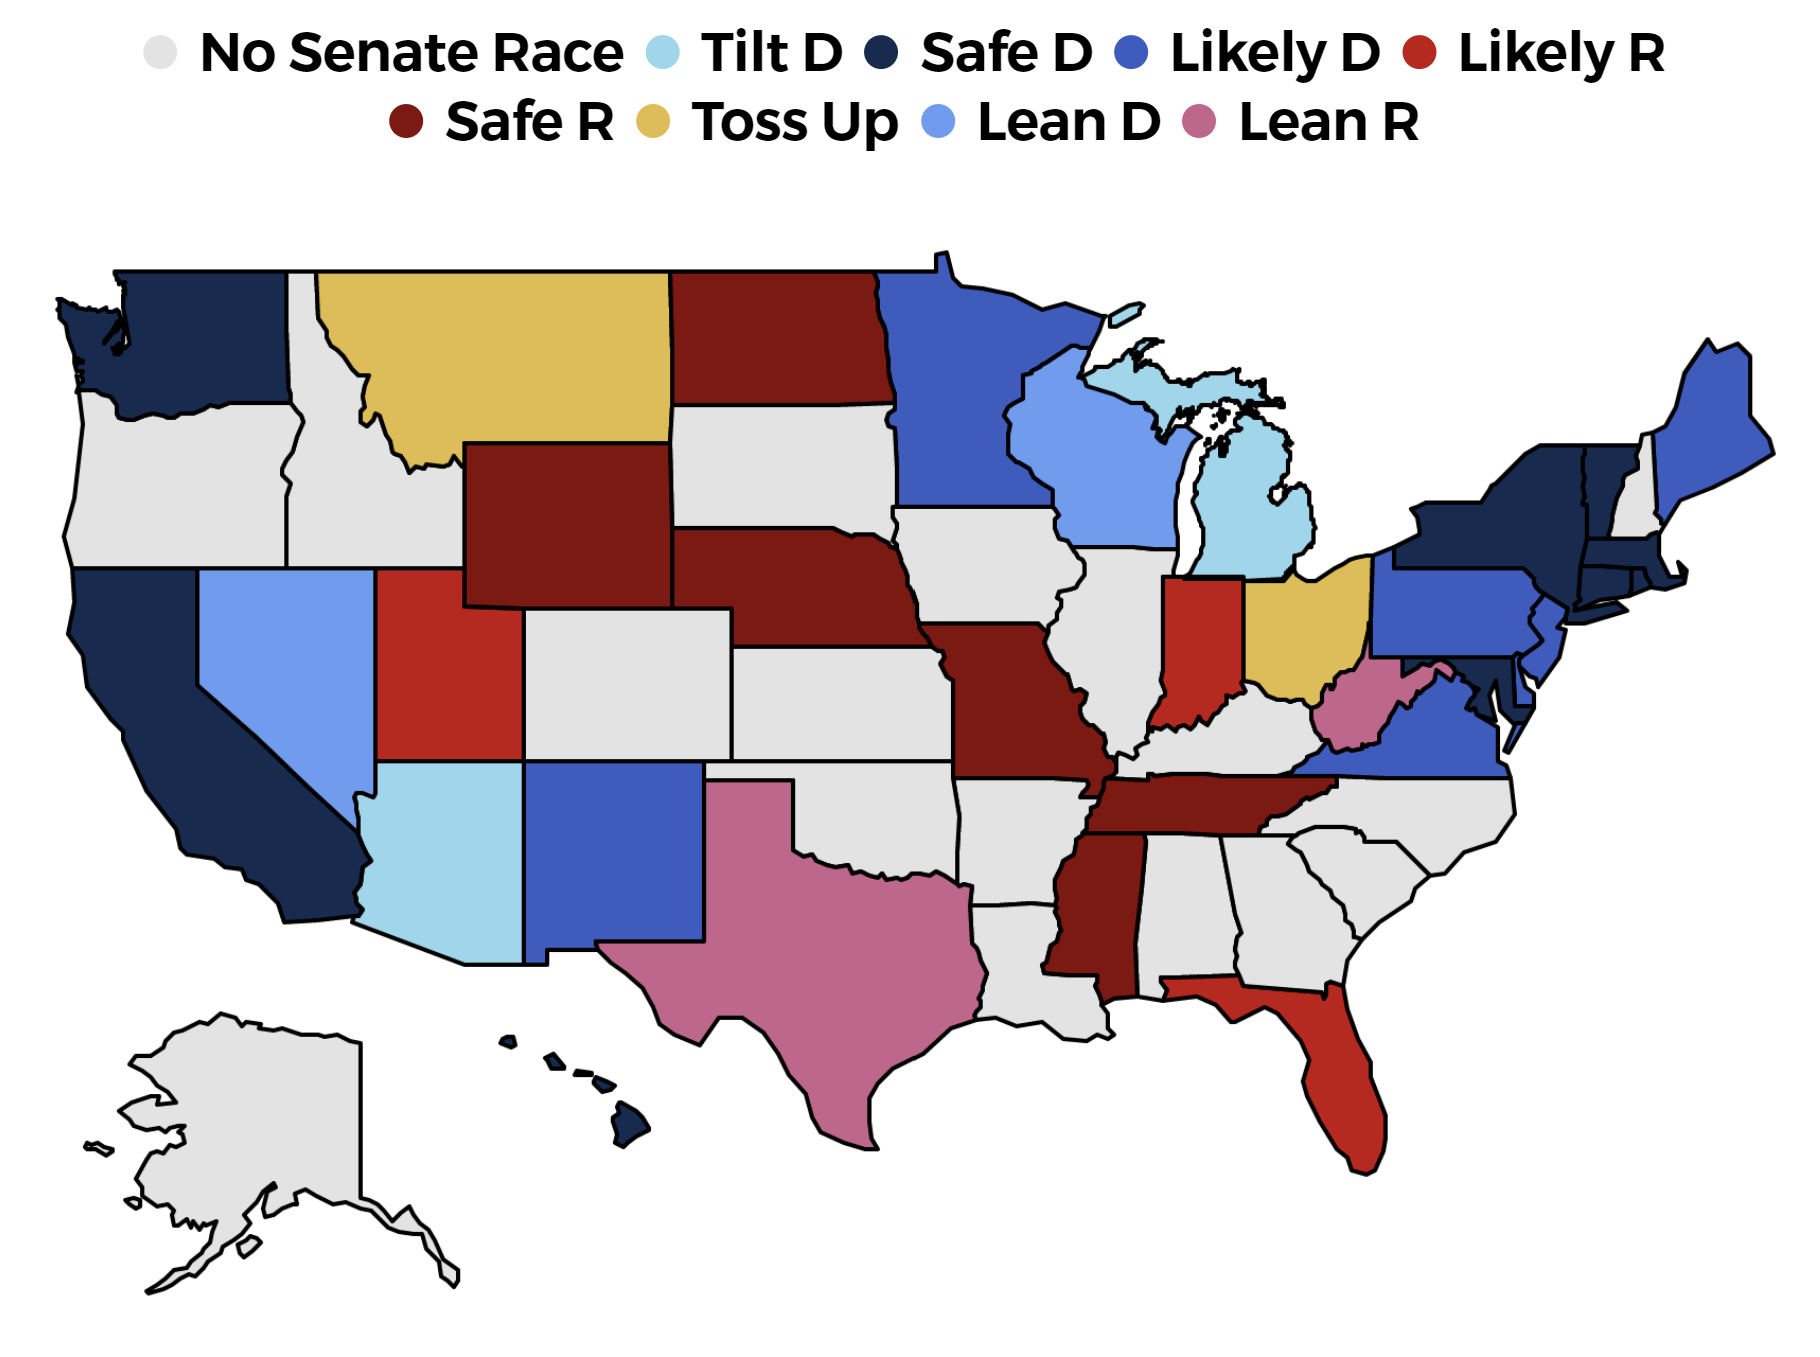
This interactive feature lets you simulate the Senate Election. It showcases the winner of the national election, includes an election map, and has a detailed breakdown of the results in each of the ten most competitive Senate races. The candidates that win their party's nomination primary have a huge impact on the results of the election. Some, like Susan Collins, consistently outperform the average nominee.
This feature is intended to be a fun way to see what might happen in November. It’s important to remember that each individual simulation has only limited predictive value on their own, because they involve a great deal of random chance, and either party can get lucky or unlucky. Every time I update the Senate Forecast, I run 50,000 simulations to ensure that luck plays a very limited role. For a formal projection on how likely each party is to capture the Senate Majority and to win each seat, visit our Senate Forecast here.
You can run through ten simulations at a time, and a new set is uploaded every day. The simulations utilize the projections made in the Senate Forecast, specifically the projected margin of victory in every race, and the chance both parties have of winning. Each sim uses randomly generated numbers to create a different outcome. The difference between the projected result and the simulation is also affected by how much uncertainty we have in each election. For example, uncertainty is higher when we are further away from election day, and when there have been few polls published.
We don’t treat each race as a separate entity. Democrats or Republicans are likely to overperform expectations nationwide, and we also run through their performance with different demographic groups, including, for example, race and education. If a party exceeds projections in Pennsylvania, there's a good chance they will do the same in a similar state like Ohio. Like in real life, sometimes a surprise scandal happens or a candidate runs a stunningly strong campaign and greatly outperforms expectations.
The Senate Forecast works exactly the same way, but it runs through 50,000 simulations of the election every day to ensure luck only plays a limited role.
Keep in mind that sometimes the results will be a little bit wacky - especially when we have a long time until election day. This isn’t a sign of a broken forecast, as these outcomes are within the range of possibilities, even though they are unlikely. From time to time, a party can win an unexpected landslide election, like when FDR’s party picked up ten additional Senate seats despite facing a midterm election.
Read the Senate Forecast to see how likely each party is to win. In 2020, it was one of the most accurate forecasts in the nation. We also track the latest Senate polls. We have also published full-page forecasts for Arizona, Florida, and Georgia.
Update: Now, the Georgia Runoffs have been added, and occur when neither Walker nor Warnock get over 50% in the November election.
Joe Biden’s Approval Rating Map
Follow the latest polling and track Joe Biden's approval rating in every state in the nation.


