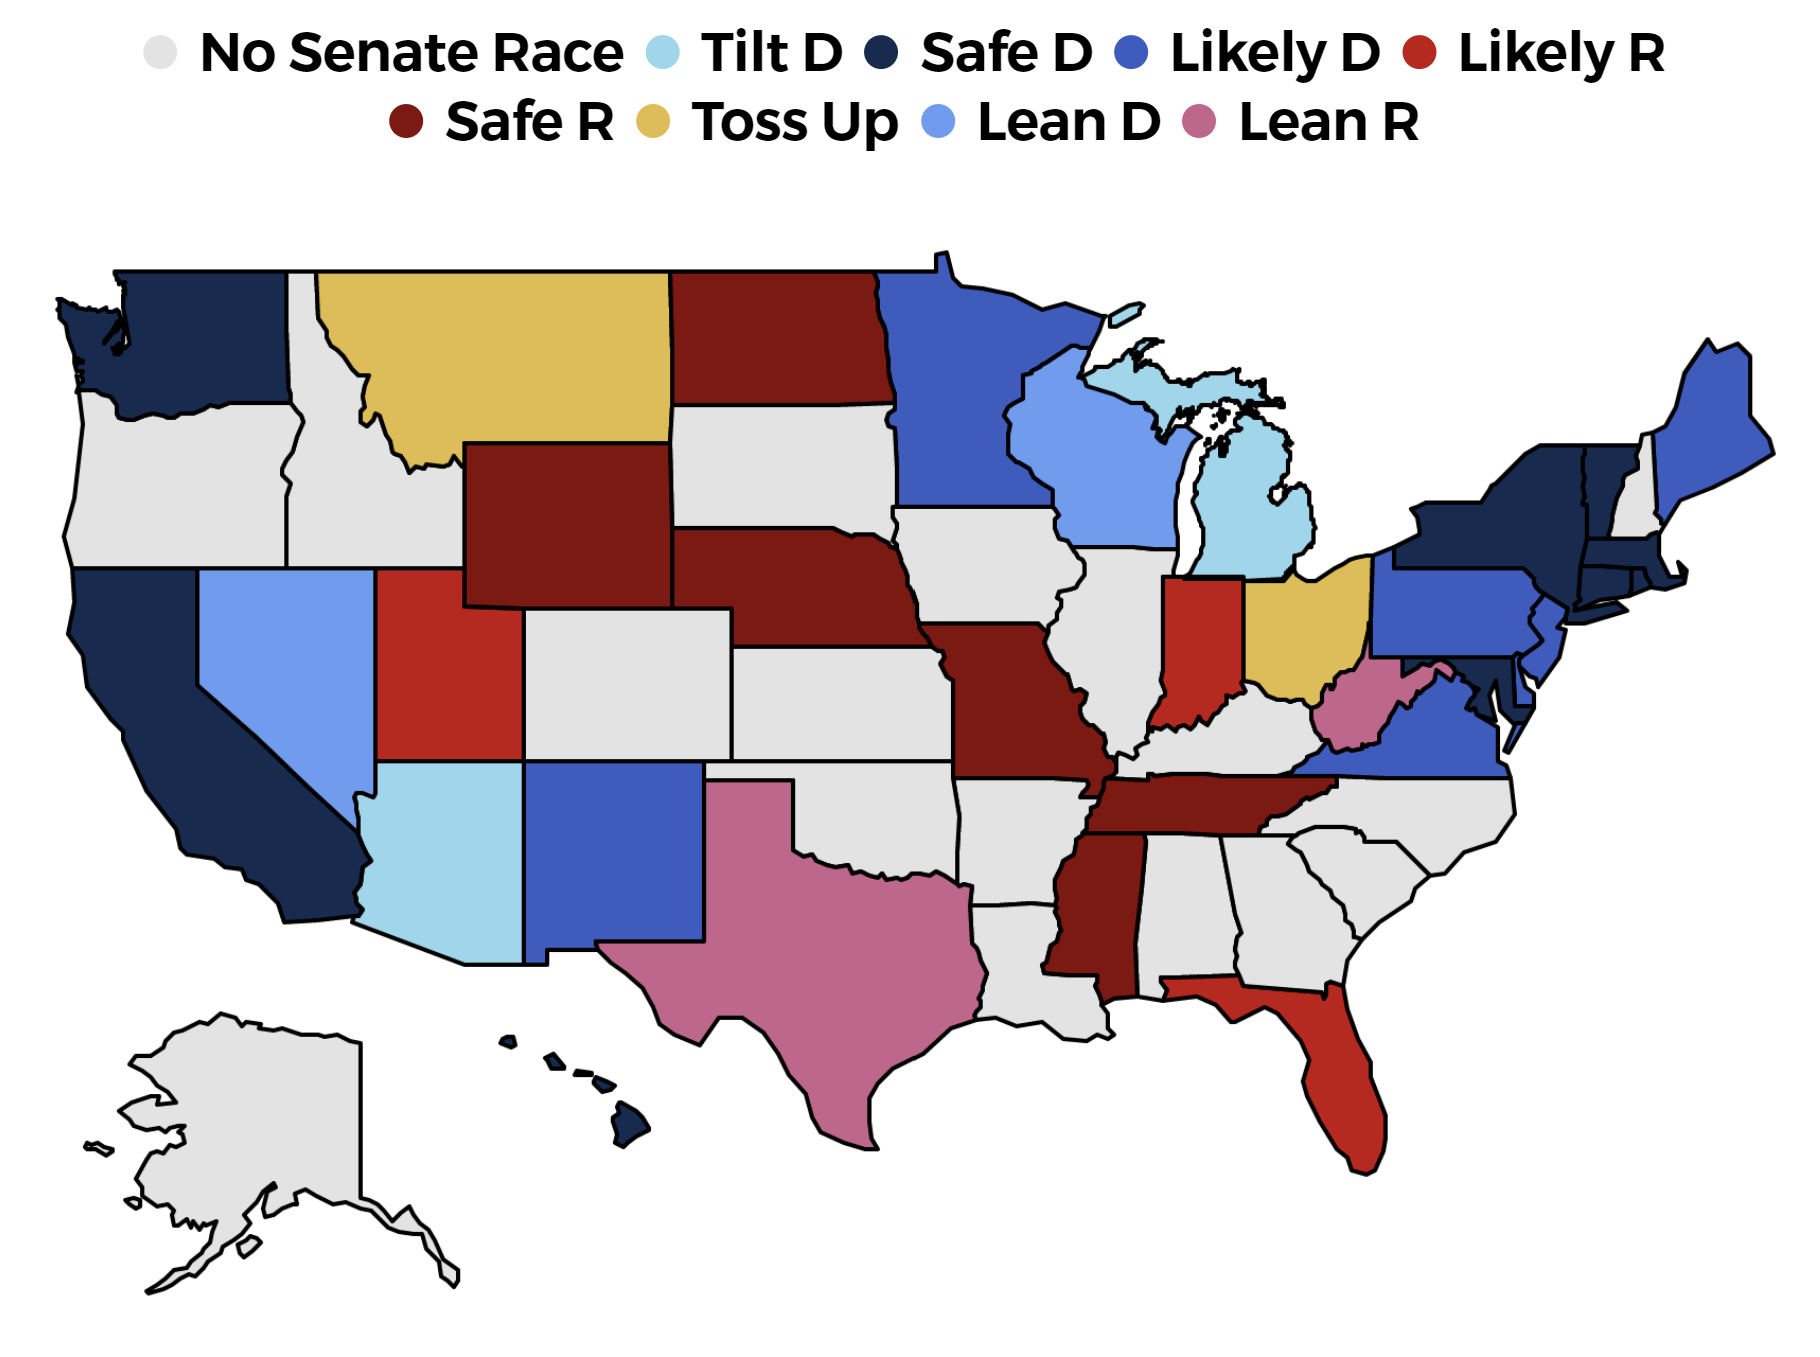
The Five Most Important Factors in the 2022 Senate Forecast
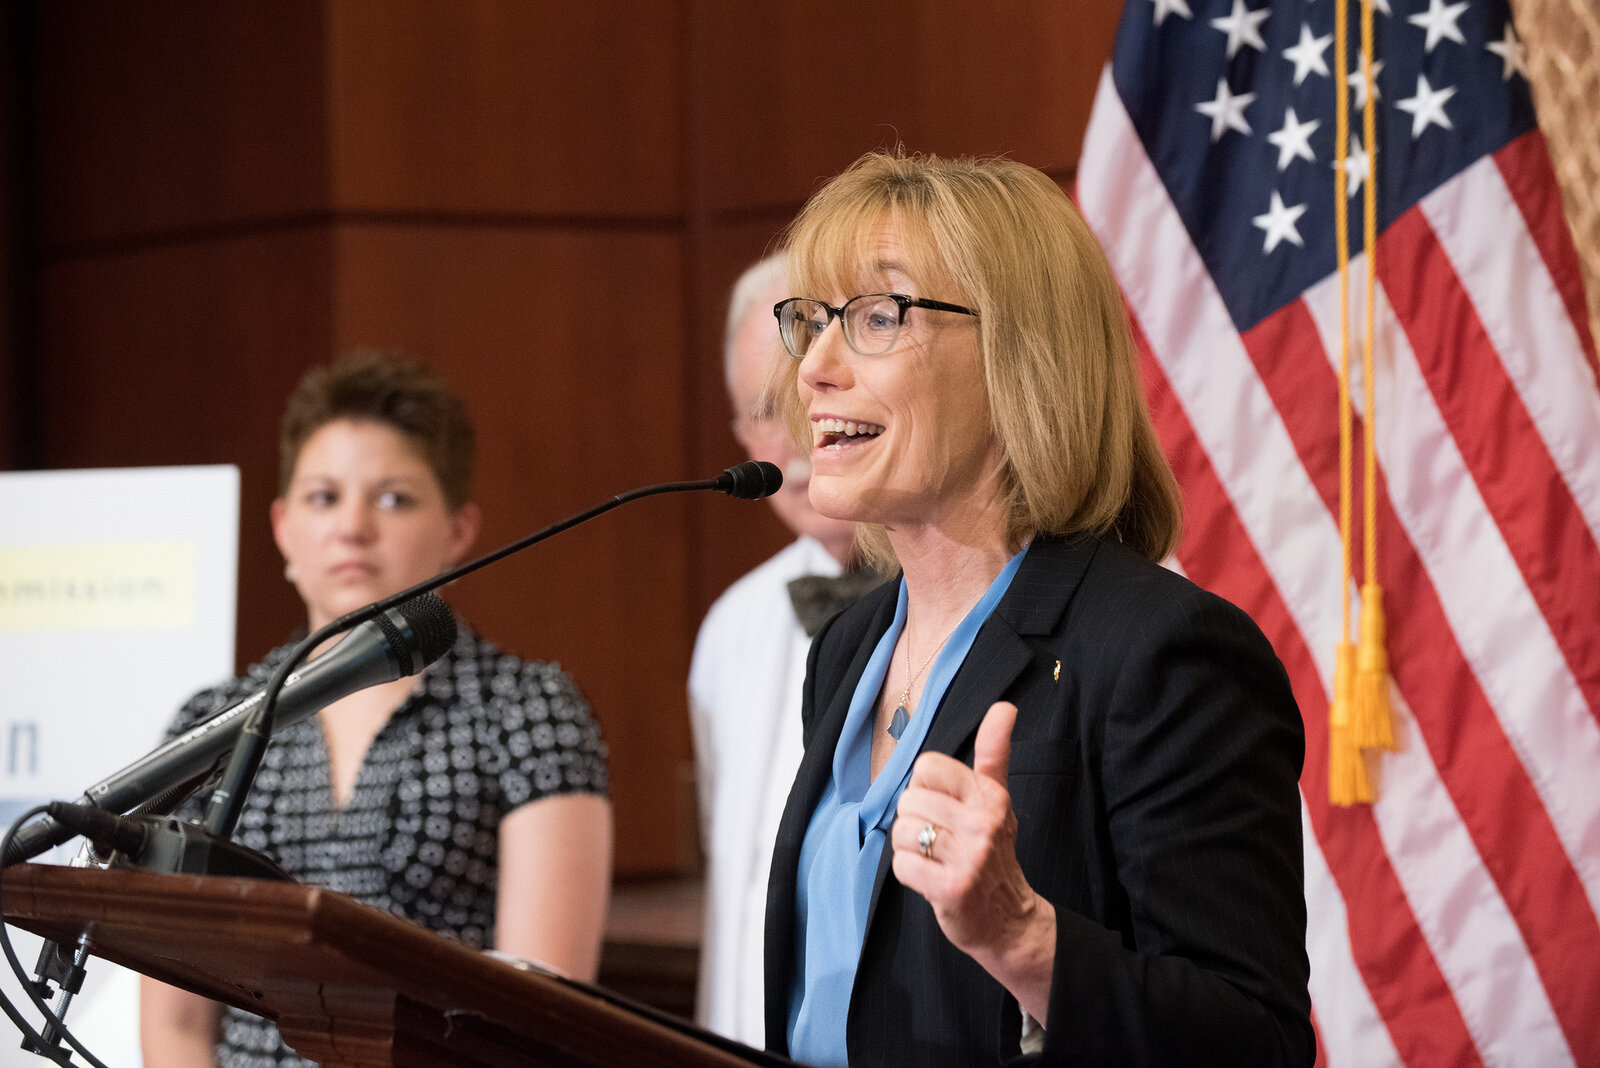
New Hampshire fell off the 2020 Political Radar in the general election, but it could become a central focus as Democratic Senator Maggie Hassan runs for re-election.
Photo Credit: Office of Senator Maggie Hassan, Public domain, via Wikimedia Commons
By: Logan Phillips
Date: November 24th
We just launched the 2022 Senate Forecast, and getting a strong projection almost two years before election day is a bit more complicated than calling it with the assistance of head to head polling. However, I designed the forecast from the ground up with the explicit intent of providing credible predictions even very early in the election cycle.
Of course, it’s important to approach the forecast with a serious degree of caution. We have no idea how a Biden administration will be received by the American people, and whether the voters Donald Trump brought into politics for the first time - both to support and oppose him - will stay engaged in future elections. Nonetheless, there’s still enough information to provide us with the road map for the 2022 election. In particular, we can get a pretty good understanding of which races are likely to be the most competitive.
By the time we got to election day, polling was the most influential component in both the Presidential and Senate in Race to the WH Forecasts, however other indicators are weighted far more heavily p at this early stage. Here are the top five most influential factors in the forecast at launch:
1. Political Lean:
Political Lean tracks the degree to which a state has voted more for Democrats or Republicans than the nation at large since 2016. Let's use Arizona as an example, which was one of the closest states in this past Presidential election. It voted for Joe Biden by 0.3%, in a year where the popular vote will go to Biden by a little more than 4.0% when all of the remaining votes in New York are counted.
We’d say that in 2020, Arizona leaned 3.7% more towards Republicans. That makes up the lion share of my forecast lean, but I also factor in 2018 and 2016. Combined, our Forecast has Arizona at leaning 4.3% towards Republicans.
Mark Kelly just won John McCain’s Seat in a 2020 special election, but he’ll have to run again in the normally scheduled election in 2022 to hold the seat. Photo Credit: Gage Skidmore from Peoria, AZ
This measure is imperfect for states undergoing political transformations. Arizona used to lean 13% towards Republicans, and all indications are that it will likely continue to shift over the next few years. In the future, I might add a new component that projects further shifts in states whose politics have changed dramatically in recent years, like Arizona, Georgia, or Iowa.
2. The Incumbent's Last Election
When a Senator is running for re-election, one of the best tools we have to predict their next race is their performance in their last election. I start with their margin of victory, or how much they won the vote by in their last election. However, that's just the beginning, because my goal is to get as good of a read as possible on how they would perform in a neutral environment.
Let’s use New Hampshire Senator Maggie Hassan as an example, who is up for re-election this cycle. Her last election was one of the nation’s closest races in recent history, and she beat a Republican incumbent by just over 0.1%. Fortunately for Hassan, her adjusted margin of victory is a little bit larger.
First, I take into account the national environment, and specifically which party won the majority of the vote in the house elections. I use this instead of the Senate because roughly a third of states don’t have Senate elections every cycle. Republicans won the House vote by 1.1% that year. That raises Hasan’s total to 1.2%
Second, I give candidates that took on and beat a sitting incumbent a boost, because it’s considerably harder to win as a challenger than as a sitting incumbent. This gives Hassan an additional 5.0%.
Finally, especially in recent years, the political landscape in many states has changed pretty dramatically since the last election. In Hassan’s case, New Hampshire has shifted 1.5% more towards Republicans since 2016. Added together, Hassan’s Adjusted Margin of Victory is 4.7%.
3. Net Approval Ratings
Approval ratings are a useful indicator of whether a candidate could over or under perform the political leanings of their state. It’s also an early indicator of whether a candidate has gained or lost ground since their last election. Specifically, I look at approval ratings subtracted by disapproval ratings to get a candidate’s net approval.
Senator Tim Scott of South Carolina, for example, has attracted high levels of support from Republicans and Independents alike, and has a net +30% approval rating.
Senator Ron Johnson of Wisconsin is in a much more vulnerable position, and lost considerable ground over the last two years as he embraced a much more partisan role in the Senate. His net approval rating is -7%. This is hardly the kiss of death for his campaign, but it’s a canary in the coal mine that suggest a strong challenger in a competitive national election could have a good shot at knocking him out of the Senate.
4. Experience
I give every candidate a score from 0 to 3 based off their highest elected office to this point. Senators and Governors perform the best in Senate elections and get all three points. Former statewide elected officials, like Lieutenant Governors, get two points. U.S. Reps get 1.5 points. First-time candidates get zero points.
This will play a much bigger role in the future, and when parties are able to recruit candidates with a history of winning state wide elections to run in the primary, their chances of winning the election will go up. In North Carolina, for example, Democrats would switch from slight underdogs to modest favorites if they can recruit a Governor Roy Cooper.
All indications suggest Pete Buttigieg is headed for a role in the Biden Administration. However, he’d be the dream recruit for Indiana Democrats, and one
There are a few unusual situations where this can be imperfect. On the very off chance that Pete Buttigieg ran for Senate, he has an election record that’s clearly more impressive than being a mayor of a city of 100k, which is normally worth only one point. I’d probably treat him like a Governor/Senator.
For fun, I plugged Pete Buttigieg into the model, and I assumed that he’d go on to raise 60% of the total funds in that race, a modest assumption given his remarkable fundraising success in 2020. While a generic Democrat has a 6% shot in the forecast, Buttigieg’s chances of winning would be 24%.
5. Expert Ratings
Finally, I added a new element for 2022. I'm now including the expert ratings by Cook Political Report and the University of Virginia's Center for Politics. This early, there are going to be nuances to these races that won't be picked up by my analytics, and I'm hoping these predictions will help my forecast correctly anticipate the shape of this election cycle.
However, their impact will be reduced considerably over time, down to 0% in states with high levels of polling.
